Microstructural characteristics (SEM–EDS)
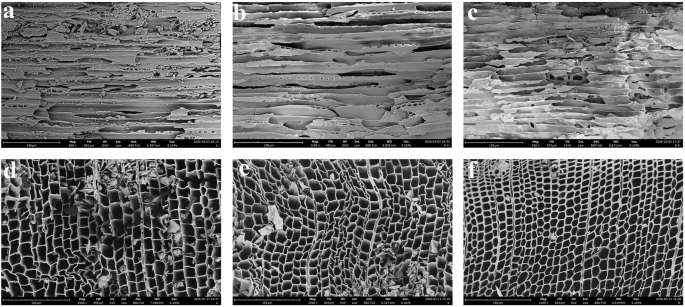
Scanning electron microscopy reveals clear depth-dependent variations in microstructural preservation among the archaeological wood samples (Fig. 2).
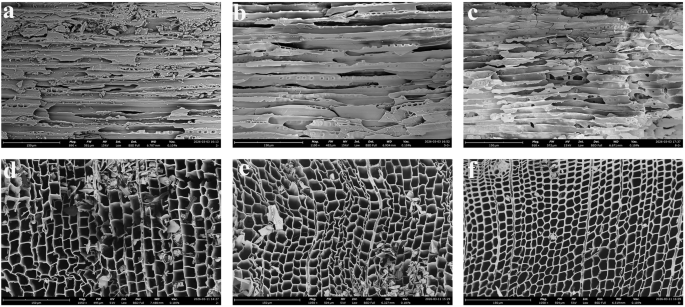
Representative SEM images showing depth-dependent microstructural preservation in archaeological wood: a tangential section of the surface region (severely degraded), b tangential section of the middle region (moderately degraded), c tangential section of the inner region (mildly degraded), d transverse section of the surface region (severely degraded), e transverse section of the middle region (moderately degraded), and f transverse section of the inner region (mildly degraded). In the surface region, cell walls appear loosened, lumen boundaries are irregular, and partial collapse of secondary wall layers is visible. In the middle region, the overall cellular organisation remains recognisable, although local wall deformation and surface roughening are present. In the inner region, cell lumina, wall thickness and pits remain comparatively well preserved, indicating relatively intact cellular morphology. SEM scanning electron microscopy.
Surface-layer specimens, particularly those from the outer regions of the tomb door components (samples 1–8), exhibit pronounced structural deterioration. Cell walls appear loosened and locally thinned, lumen boundaries are irregular, and pits show partial opening or deformation (Fig. 2a). In some regions, collapse of secondary wall layers and increased porosity are observable, indicating substantial structural disruption in the outer zones.
Samples obtained from intermediate depths, including middle sections of tomb doors and shallow regions of coffin struts, retain recognisable cellular morphology with partially preserved wall continuity (Fig. 2b). Although minor wall deformation and localised surface roughness are present, the overall structural organisation remains identifiable, suggesting a moderate level of degradation relative to surface regions.
Deep-layer samples, such as the innermost coffin struts, wooden figurine elements and internal coffin components, display the most intact microstructure (Fig. 2c). Cell lumina maintain rounded outlines, wall thickness appears relatively uniform, and pits remain largely closed. Only limited signs of natural ageing are observed, indicating comparatively well-preserved cellular architecture in the inner regions.
Overall, SEM observations demonstrate a consistent depth-dependent gradient in structural preservation, characterised by severe deterioration in surface layers, intermediate degradation in transitional zones and relatively intact microstructure in deeper regions. Complementary EDS analysis detected only trace amounts of inorganic elements (e.g., Na, Mg, S and Cl), indicating the presence of minor environmental ions within degraded regions. However, no crystalline salt particles were observed in the SEM images, suggesting that these ions are mainly dispersed or adsorbed within the wood matrix rather than forming visible mineral phases. These observations are consistent with a heterogeneous distribution of deterioration processes across depth.
For comparison, SEM observations of fresh wood show intact cellular structure with well-preserved cell walls and pits (Figure S2). SEM observations were performed on transverse, tangential and radial surfaces where preservation permitted. Owing to the fragility and irregular morphology of some archaeological samples, not all specimens were suitable for SEM preparation in all anatomical directions. Therefore, representative samples from different structural components and depths were selected for microstructural observation. Semi-quantitative EDS analysis further confirms the presence of minor inorganic elements such as Na, Mg, S and Cl within the wood matrix, while their concentrations remain generally below 1 wt% (Table S1).
Density and maximum moisture content (Umax)
Distinct variations in both density and maximum moisture content (Umax) were observed among different structural components and depth layers of the archaeological wood samples (Fig. 3).

Density and maximum moisture content vary systematically among structural components and across depth layers. Lower density and higher Umax values are generally observed in the more degraded outer layers, whereas inner layers and internal components show relatively higher density and lower Umax values. Values represent mean ± SD (n = 3). Umax, maximum moisture content.
The layered tomb door samples (Nos. 1–8) exhibited relatively low densities ranging from 0.182 to 0.221 g/cm³, with a gradual increase from the outer to inner layers. Correspondingly, these samples showed generally high Umax values (414–502%), with sample 8 reaching the highest value of 501.99%.
The coffin struts samples (Nos. 9–13) displayed densities between 0.197 and 0.289 g/cm³, showing a moderate increase with depth, particularly in samples 12 and 13. Their Umax values ranged from 331 to 496%, also exhibiting depth-related variation.
Samples obtained from deeper structural components (Nos. 14–16) exhibited comparatively higher densities (0.220–0.325 g/cm³), approaching but still remaining significantly lower than the density reported for sound Larix potaninii wood (approximately 0.48–0.65 g/cm³)3,24. Correspondingly, these samples showed lower Umax values (126.91–315.07%) compared with the more deteriorated outer layers.
Overall, an inverse relationship between density and maximum moisture content is evident across the samples. Distinct differences are observed among structural components, while consistent depth-dependent gradients occur within individual components, characterised by lower density and higher moisture capacity in outer layers and comparatively better preservation in inner regions. Compared with sound wood reported in the literature, the archaeological samples exhibit significantly reduced density and elevated moisture capacity, reflecting substantial structural degradation of the cell wall framework.
pH and electrical conductivity
The pH values of the sixteen samples ranged from 6.34 to 7.21, falling overall within a weakly acidic to neutral range (Fig. 4). Variations among different structural components were relatively limited. Samples from the tomb doors (Nos. 1–8) exhibited pH values of 6.34–6.81, coffin struts (Nos. 9–13) ranged from 6.68 to 7.01, while deeper structural components including wooden figurine elements and internal coffin parts (Nos. 14–16), ranged from 6.89 to 7.21. A slight increasing trend in pH from outer to inner regions is observable, although the magnitude of variation remains small, indicating the absence of pronounced acidification or alkalisation across the samples. For reference, deionised water showed a near-neutral pH (pH 7.44) and very low conductivity (3.63 μS·cm−1), while fresh Larix potaninii wood extracted under the same conditions (0.272 g in 40 mL deionised water) yielded a slightly alkaline pH (pH 7.58) and low conductivity (37.0 μS·cm−1).

The figure compares the pH and electrical conductivity of archaeological wood samples from different structural components and depth layers. pH values remain within a weakly acidic to neutral range, whereas electrical conductivity shows marked variation and generally decreases from outer to inner regions. Reference measurements of deionised water and fresh Larix potaninii wood extract are also shown for comparison. Values represent mean ± SD (n = 3).
In contrast, electrical conductivity exhibited substantial variation, with values normalised to 0.5 g dry mass ranging from 151 to 1511 μS·cm−1 (Fig. 4). Surface-layer tomb door samples (Nos. 1–8) generally showed higher conductivity, with samples 2 and 7 exceeding 1000 μS·cm−1. Coffin struts samples (Nos. 9–13) displayed moderate conductivity values between 430 and 902 μS·cm−1, whereas deeper structural components (Nos. 14–16) exhibited the lowest values (151–247 μS·cm−1). Overall, conductivity demonstrates a clear depth-dependent decrease from outer to inner regions, indicating a heterogeneous distribution of soluble inorganic constituents within the wood structure. Notably, the conductivity of archaeological samples is consistently much higher than that of fresh wood and the deionised-water blank, suggesting an additional contribution from burial environment-derived soluble ions.
Chemical characteristics revealed by FTIR
All samples exhibited absorption bands at positions consistent with fresh Larix potaninii wood, including characteristic peaks at approximately 3380, 2930, 1730, 1600, 1510, 1450, 1420, 1370, 1320, 1260, 1160, 1050, and 897 cm−1, although peak intensities varied substantially among samples (Fig. 5).

The figure shows the FTIR spectral characteristics of archaeological wood samples with different preservation states. Characteristic absorption bands at 1730, 1600, 1510, 1450, 1420, 1370, 1320, 1260, 1160, 1050, and 897 cm−1 are indicated. Variations in band intensity reflect differences in polysaccharide degradation, relative lignin enrichment and oxidation-related changes among samples. FTIR, Fourier transform infrared spectroscopy.
To enable quantitative comparison, spectra were normalised using the aromatic skeletal vibration band at 1510 cm−1 as an internal reference, which is generally considered relatively stable during wood degradation due to the higher resistance of lignin compared with polysaccharides21,22. Relative intensity ratios I₁₅₁₀/I₁₀₅₀ and I₁₅₁₀/I₈₉₇ were calculated to evaluate polysaccharide degradation and relative lignin enrichment. Each sample was measured at least three times at different positions, and averaged spectra were used for analysis to minimise local heterogeneity.
Samples from surface and intermediate regions, particularly the outer tomb door layers and shallow coffin struts zones, exhibited markedly reduced absorption at 1050 cm−1 (C–O–C stretching of cellulose and hemicellulose) and 897 cm−1 (β-1,4-glycosidic linkages), with the 897 cm−1 band nearly disappearing in some cases, indicating substantial polysaccharide degradation. Correspondingly, relative increases in aromatic skeletal vibration bands at 1600 and 1510 cm−1 were observed, resulting in elevated I₁₅₁₀/I₁₀₅₀ and I₁₅₁₀/I₈₉₇ ratios.
In contrast, deep structural components such as the coffin lid and wedges exhibited comparatively minor spectral changes, with ratio values approaching those of fresh wood. Additionally, enhanced absorption in the 1710–1730 cm−1 region, together with increased intensity near 3380 cm−1, was observed in more degraded samples, suggesting the accumulation of oxidation products such as carbonyl and hydroxyl groups.
Overall, FTIR results demonstrate a clear depth-dependent chemical degradation gradient, characterised by preferential polysaccharide loss and relative lignin enrichment in outer layers, consistent with the structural deterioration observed in SEM analysis.
Cellulose crystallinity (XRD)
The crystallinity (CrI) of the samples ranged from 25.9 to 47.5%, with significant variations observed between different structural elements and depths (Fig. 6). Layered samples from the tomb door (Nos. 1–8) predominantly exhibited CrI values between 26 and 36%, with only a few layers (e.g., No. 2) showing slightly higher readings. This indicates more pronounced degradation of the crystalline cellulose regions in the surface and middle zones.

The figure shows variations in cellulose crystallinity among archaeological wood samples from different structural components and depth layers. Lower CrI values are generally associated with the more degraded outer layers, whereas deeper and better-preserved components exhibit higher crystallinity. Values represent mean ± SD (n = 3). CrI, crystallinity index.
Most coffin struts (samples 9–13) fell within the 30–35% range, while the innermost sample 13 reached 46.3%, indicating superior preservation. Deep structural elements (samples 14–16) exhibited the highest crystallinity values (approximately 44–48%), approaching the crystallinity reported for sound Larix wood (typically around 45–55%)23,25.
Crystallinity shows a clear increasing trend with depth, with the lowest values in surface layers, moderate values in intermediate zones, and the highest values in deeper structural components. Cross-sectionally, spatial gradients also occur between different structural elements, with the tomb door showing the lowest values, coffin struts intermediate, and the coffin lid and wedges the highest. This pattern suggests that cellulose microfibrils undergo preferential degradation in the outer layers, while the inner regions retain comparatively intact crystalline structure.
Degassing behaviour characteristics
Following vacuum degassing at 80 °C, sixteen specimens—including tomb door sections (Nos. 1–8), coffin struts (Nos. 9–13), and wooden horse/coffin lid fragments (Nos. 14–16)—exhibited distinct mass-loss behaviours (Fig. 7a). Based on the final mass-loss rates, the samples can be broadly classified into three categories.

Sixteen samples from different structural components were degassed at 80 °C. Samples 1–8 represent tomb door layers, samples 9–13 correspond to coffin struts, and samples 14–16 originate from inner wooden elements. Based on the final mass-loss values, the samples are classified into three categories: Category I ( > 10%), Category II (7.8–9.8%), and Category III ( < 7.8%). The overall decrease in mass loss from outer to inner structural components indicates a depth-dependent gradient in degradation and volatile content within the wood structure.
Category I comprises samples with relatively high mass-loss values (>10%), including several tomb door layers (Samples 1, 3, 6 and 7) and one coffin struts sample (Sample 9).
Category II includes samples with moderate mass-loss rates (approximately 7.8–9.8%), comprising several tomb door layers and most coffin struts samples.
Category III consists of samples with the lowest mass-loss values, including Samples 13, 15 (7.70%) and 16 (7.01%).
These three categories reflect clear differences in degassing behaviour among the analysed specimens. Higher mass-loss values observed in outer structural elements likely reflect greater amounts of loosely bound moisture and volatile degradation products associated with severe cell wall deterioration.
Moisture sorption isotherms
Water vapour adsorption isotherms measured at 25 °C for samples 1–16 exhibit sigmoidal profiles characteristic of hygroscopic wood materials, while notable differences are observed in moisture uptake capacity among samples (Fig. 8a). At P/P₀ ≈ 0.95, the terminal moisture uptake values further highlight these differences, with Sample 9 showing the highest adsorption capacity (Fig. 8b).

a Water vapour adsorption isotherms plotted as relative pressure (P/P₀) versus moisture uptake for samples 1–16. Samples 1–8 represent tomb door layers, samples 9–13 correspond to coffin struts, and samples 14–16 represent inner structural components. b Moisture uptake values at P/P₀ ≈ 0.95 extracted from the terminal adsorption point, highlighting differences in high-humidity adsorption capacity among samples. P/P₀, relative pressure.
At low relative humidity (P/P₀ < 0.4), moisture uptake values among all samples remain relatively close, generally ranging from approximately 30 to 110 mg·g−1.
In the intermediate humidity range (0.4 < P/P₀ < 0.7), differences between samples become more apparent. Several specimens display a gradual increase in adsorption, whereas others exhibit comparatively lower uptake values.
At high relative humidity (P/P₀ > 0.7), the divergence among samples becomes more pronounced. Some specimens show a steep increase in adsorption capacity, while others exhibit more moderate increases. The highest adsorption value is observed for Sample 9, approaching approximately 500 mg·g−1 at P/P₀ = 0.95. In contrast, several samples remain below approximately 300 mg·g−1 across the same humidity range.
These results indicate noticeable variation in moisture adsorption behaviour among the analysed specimens, which is consistent with the increased porosity and microstructural damage observed in severely degraded surface layers.