Apr 18, 2026
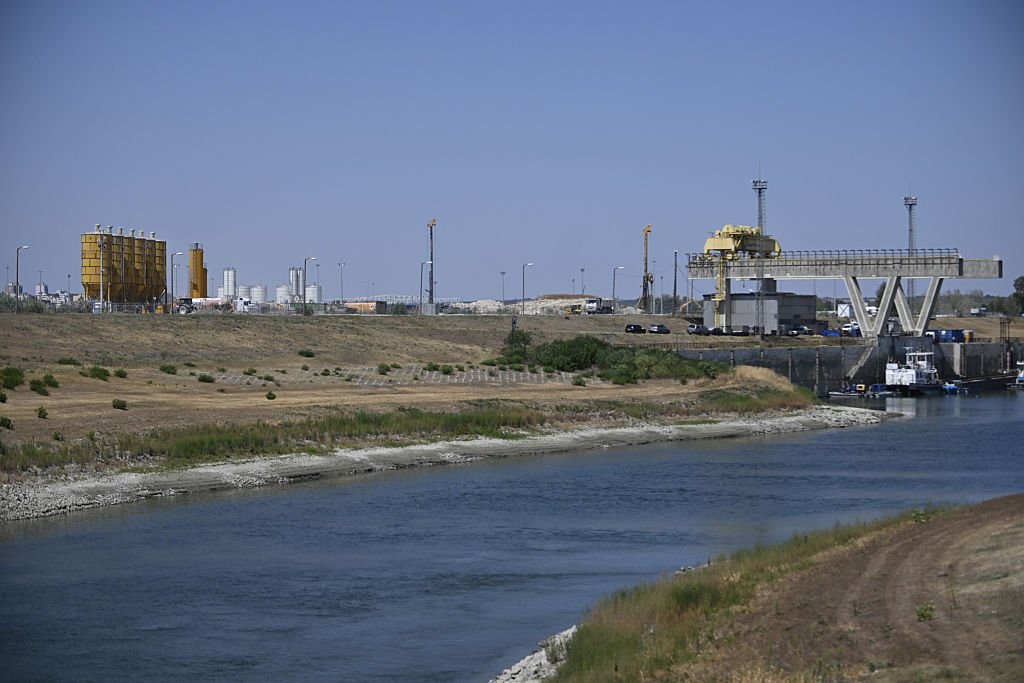
The UK government has outlined procedures for accessing records of environmental applications and statements related to offshore energy activities. According to the Department for Energy Security and Net Zero, interested parties can review submissions made to its Offshore Petroleum Regulator for Environment and Decommissioning.
Most applications for environmental approvals are now received and processed through the UK Energy Portal Environmental Tracking System. This system replaced an earlier application framework known as the Petroleum Operations Notice system. Summary lists of applications handled through the portal, covering operations such as drilling, production, and decommissioning from the year the system launched, are available online. These lists can be filtered and downloaded.
For submissions not yet finalized, the public may submit comments, with deadlines provided upon request. The department typically aims to decide on most submissions within 28 days of receipt, though longer timelines apply for documents like Environmental Statements and Oil Pollution Emergency Plans. Separate lists are maintained for Environmental Statements currently under consideration and those previously reviewed.
Historical application data processed under the old system is accessible in annual lists dating back to 2009 for various notice types. Certain proposals are exempt from submission requirements under specific regulations if they are unlikely to significantly affect the environment. Examples include limited pipeline construction near existing infrastructure or consent renewals that do not increase production or storage levels.
Regarding marine licensing, since the introduction of the Marine and Coastal Access Act 2009, licenses are required for a limited number of offshore energy activities not excluded from the act, principally related to decommissioning. The department maintains a public register of these licenses. Following that act, there have been no applications for a specific type of license related to reserved oil and gas activities in Scottish territorial waters.
Separate regulatory frameworks govern combustion installations and emissions. The Offshore Combustion Installations Regulations, amended in 2018, introduced permitting requirements for new and existing medium combustion plants based on their thermal input and specific deadlines. A public register for permitted medium combustion plants is maintained. Furthermore, a spreadsheet details applications submitted under Greenhouse Gas Emissions Trading Scheme Regulations.
For oil pollution preparedness, a list of Oil Pollution Emergency Plan submissions that are active or under review is available. The department also administers Consent to Locate applications, with lists available through the current portal and for prior years. Historical enquiries for certain licenses should be directed to other specified agencies.
-
1. INTRODUCTION
Making Data-Driven Decisions to Grow Your Business
- REPORT DESCRIPTION
- RESEARCH METHODOLOGY AND THE AI PLATFORM
- DATA-DRIVEN DECISIONS FOR YOUR BUSINESS
- GLOSSARY AND SPECIFIC TERMS
-
2. EXECUTIVE SUMMARY
A Quick Overview of Market Performance
- KEY FINDINGS
- MARKET TRENDS This Chapter is Available Only for the Professional EditionPRO
-
3. MARKET OVERVIEW
Understanding the Current State of The Market and its Prospects
- MARKET SIZE: HISTORICAL DATA (2012–2025) AND FORECAST (2026–2035)
- CONSUMPTION BY COUNTRY: HISTORICAL DATA (2012–2025) AND FORECAST (2026–2035)
- MARKET FORECAST TO 2035
-
4. MOST PROMISING PRODUCTS FOR DIVERSIFICATION
Finding New Products to Diversify Your Business
- TOP PRODUCTS TO DIVERSIFY YOUR BUSINESS
- BEST-SELLING PRODUCTS
- MOST CONSUMED PRODUCTS
- MOST TRADED PRODUCTS
- MOST PROFITABLE PRODUCTS FOR EXPORT
-
5. MOST PROMISING SUPPLYING COUNTRIES
Choosing the Best Countries to Establish Your Sustainable Supply Chain
- TOP COUNTRIES TO SOURCE YOUR PRODUCT
- TOP PRODUCING COUNTRIES
- TOP EXPORTING COUNTRIES
- LOW-COST EXPORTING COUNTRIES
-
6. MOST PROMISING OVERSEAS MARKETS
Choosing the Best Countries to Boost Your Export
- TOP OVERSEAS MARKETS FOR EXPORTING YOUR PRODUCT
- TOP CONSUMING MARKETS
- UNSATURATED MARKETS
- TOP IMPORTING MARKETS
- MOST PROFITABLE MARKETS
-
7. PRODUCTION
The Latest Trends and Insights into The Industry
- PRODUCTION VOLUME AND VALUE: HISTORICAL DATA (2012–2025) AND FORECAST (2026–2035)
- PRODUCTION BY COUNTRY: HISTORICAL DATA (2012–2025) AND FORECAST (2026–2035)
-
8. IMPORTS
The Largest Import Supplying Countries
- IMPORTS: HISTORICAL DATA (2012–2025) AND FORECAST (2026–2035)
- IMPORTS BY COUNTRY: HISTORICAL DATA (2012–2025) AND FORECAST (2026–2035)
- IMPORT PRICES BY COUNTRY: HISTORICAL DATA (2012–2025) AND FORECAST (2026–2035)
-
9. EXPORTS
The Largest Destinations for Exports
- EXPORTS: HISTORICAL DATA (2012–2025) AND FORECAST (2026–2035)
- EXPORTS BY COUNTRY: HISTORICAL DATA (2012–2025) AND FORECAST (2026–2035)
- EXPORT PRICES BY COUNTRY: HISTORICAL DATA (2012–2025) AND FORECAST (2026–2035)
-
10. PROFILES OF MAJOR PRODUCERS
The Largest Producers on The Market and Their Profiles
-
11. COUNTRY PROFILES
The Largest Markets And Their Profiles
This Chapter is Available Only for the Professional Edition
PRO-
11.1
United States
- Market Size
- Production
- Imports
- Exports
-
11.2
China
- Market Size
- Production
- Imports
- Exports
-
11.3
Japan
- Market Size
- Production
- Imports
- Exports
-
11.4
Germany
- Market Size
- Production
- Imports
- Exports
-
11.5
United Kingdom
- Market Size
- Production
- Imports
- Exports
-
11.6
France
- Market Size
- Production
- Imports
- Exports
-
11.7
Brazil
- Market Size
- Production
- Imports
- Exports
-
11.8
Italy
- Market Size
- Production
- Imports
- Exports
-
11.9
Russian Federation
- Market Size
- Production
- Imports
- Exports
-
11.10
India
- Market Size
- Production
- Imports
- Exports
-
11.11
Canada
- Market Size
- Production
- Imports
- Exports
-
11.12
Australia
- Market Size
- Production
- Imports
- Exports
-
11.13
Republic of Korea
- Market Size
- Production
- Imports
- Exports
-
11.14
Spain
- Market Size
- Production
- Imports
- Exports
-
11.15
Mexico
- Market Size
- Production
- Imports
- Exports
-
11.16
Indonesia
- Market Size
- Production
- Imports
- Exports
-
11.17
Netherlands
- Market Size
- Production
- Imports
- Exports
-
11.18
Turkey
- Market Size
- Production
- Imports
- Exports
-
11.19
Saudi Arabia
- Market Size
- Production
- Imports
- Exports
-
11.20
Switzerland
- Market Size
- Production
- Imports
- Exports
-
11.21
Sweden
- Market Size
- Production
- Imports
- Exports
-
11.22
Nigeria
- Market Size
- Production
- Imports
- Exports
-
11.23
Poland
- Market Size
- Production
- Imports
- Exports
-
11.24
Belgium
- Market Size
- Production
- Imports
- Exports
-
11.25
Argentina
- Market Size
- Production
- Imports
- Exports
-
11.26
Norway
- Market Size
- Production
- Imports
- Exports
-
11.27
Austria
- Market Size
- Production
- Imports
- Exports
-
11.28
Thailand
- Market Size
- Production
- Imports
- Exports
-
11.29
United Arab Emirates
- Market Size
- Production
- Imports
- Exports
-
11.30
Colombia
- Market Size
- Production
- Imports
- Exports
-
11.31
Denmark
- Market Size
- Production
- Imports
- Exports
-
11.32
South Africa
- Market Size
- Production
- Imports
- Exports
-
11.33
Malaysia
- Market Size
- Production
- Imports
- Exports
-
11.34
Israel
- Market Size
- Production
- Imports
- Exports
-
11.35
Singapore
- Market Size
- Production
- Imports
- Exports
-
11.36
Egypt
- Market Size
- Production
- Imports
- Exports
-
11.37
Philippines
- Market Size
- Production
- Imports
- Exports
-
11.38
Finland
- Market Size
- Production
- Imports
- Exports
-
11.39
Chile
- Market Size
- Production
- Imports
- Exports
-
11.40
Ireland
- Market Size
- Production
- Imports
- Exports
-
11.41
Pakistan
- Market Size
- Production
- Imports
- Exports
-
11.42
Greece
- Market Size
- Production
- Imports
- Exports
-
11.43
Portugal
- Market Size
- Production
- Imports
- Exports
-
11.44
Kazakhstan
- Market Size
- Production
- Imports
- Exports
-
11.45
Algeria
- Market Size
- Production
- Imports
- Exports
-
11.46
Czech Republic
- Market Size
- Production
- Imports
- Exports
-
11.47
Qatar
- Market Size
- Production
- Imports
- Exports
-
11.48
Peru
- Market Size
- Production
- Imports
- Exports
-
11.49
Romania
- Market Size
- Production
- Imports
- Exports
-
11.50
Vietnam
- Market Size
- Production
- Imports
- Exports
-
-
LIST OF TABLES
- Key Findings In 2025
- Market Volume, In Physical Terms: Historical Data (2012–2025) and Forecast (2026–2035)
- Market Value: Historical Data (2012–2025) and Forecast (2026–2035)
- Per Capita Consumption, by Country, 2022–2025
- Production, In Physical Terms, By Country: Historical Data (2012–2025) and Forecast (2026–2035)
- Imports, In Physical Terms, By Country: Historical Data (2012–2025) and Forecast (2026–2035)
- Imports, In Value Terms, By Country: Historical Data (2012–2025) and Forecast (2026–2035)
- Import Prices, By Country: Historical Data (2012–2025) and Forecast (2026–2035)
- Exports, In Physical Terms, By Country: Historical Data (2012–2025) and Forecast (2026–2035)
- Exports, In Value Terms, By Country: Historical Data (2012–2025) and Forecast (2026–2035)
- Export Prices, By Country: Historical Data (2012–2025) and Forecast (2026–2035)
-
LIST OF FIGURES
- Market Volume, In Physical Terms: Historical Data (2012–2025) and Forecast (2026–2035)
- Market Value: Historical Data (2012–2025) and Forecast (2026–2035)
- Consumption, by Country, 2025
- Market Volume Forecast to 2035
- Market Value Forecast to 2035
- Market Size and Growth, By Product
- Average Per Capita Consumption, By Product
- Exports and Growth, By Product
- Export Prices and Growth, By Product
- Production Volume and Growth
- Exports and Growth
- Export Prices and Growth
- Market Size and Growth
- Per Capita Consumption
- Imports and Growth
- Import Prices
- Production, In Physical Terms: Historical Data (2012–2025) and Forecast (2026–2035)
- Production, In Value Terms: Historical Data (2012–2025) and Forecast (2026–2035)
- Production, by Country, 2025
- Production, In Physical Terms, by Country: Historical Data (2012–2025) and Forecast (2026–2035)
- Imports, In Physical Terms: Historical Data (2012–2025) and Forecast (2026–2035)
- Imports, In Value Terms: Historical Data (2012–2025) and Forecast (2026–2035)
- Imports, In Physical Terms, By Country, 2025
- Imports, In Physical Terms, By Country: Historical Data (2012–2025) and Forecast (2026–2035)
- Imports, In Value Terms, By Country: Historical Data (2012–2025) and Forecast (2026–2035)
- Import Prices, By Country: Historical Data (2012–2025) and Forecast (2026–2035)
- Exports, In Physical Terms: Historical Data (2012–2025) and Forecast (2026–2035)
- Exports, In Value Terms: Historical Data (2012–2025) and Forecast (2026–2035)
- Exports, In Physical Terms, By Country, 2025
- Exports, In Physical Terms, By Country: Historical Data (2012–2025) and Forecast (2026–2035)
- Exports, In Value Terms, By Country: Historical Data (2012–2025) and Forecast (2026–2035)
- Export Prices, By Country: Historical Data (2012–2025) and Forecast (2026–2035)