








Protests in India: Assessing the Surge in Civic Expression Over the Last Decade
From the recent agitation surrounding NEET and various employment-related grievances to vocal demands regarding women’s safety and the functioning of the Election Commission, 2026 has witnessed a relentless cycle of public demonstrations. With new protest movements continuously making headlines, it is easy to form the impression that the nation is in a state of perpetual unrest. However, when we look past the news cycle and examine long-term trends, the data provides a clearer picture of how civic expression has evolved in India over the past ten years.
An analysis of data from the Armed Conflict Location & Event Data project (ACLED)—tracking demonstrations between 2016 and September 2026—suggests that while public dissent has indeed become more frequent, the nature of these events has undergone a significant transformation.
A Decade of Rising Demonstrations
The statistical evidence confirms that public protests have seen a marked increase over the last decade. In 2016, there were approximately 10,728 recorded demonstrations. By 2025, that figure had climbed to 20,562, representing a substantial growth of nearly 92 percent.
This upward trajectory was not linear. While the number of events rose steadily leading up to 2019, the pandemic year of 2020 saw a temporary dip. The momentum regained strength thereafter, peaking at 21,799 demonstrations in 2024. Although the number dipped slightly to 20,562 in 2025, the 18,323 protests recorded by late September 2026 indicate that the high frequency of public demonstrations remains a defining feature of the Indian landscape.
The Shift Toward Peaceful Dissent
While the total number of demonstrations has grown, a closer look at the data reveals an encouraging trend: the vast majority of these events remain peaceful. The rise in overall protest numbers is primarily driven by non-violent civic engagement.
Peaceful demonstrations surged from 8,893 in 2016 to 18,885 in 2025, with 2024 marking the first time the annual count of peaceful gatherings surpassed 20,000. In contrast, violent demonstrations have failed to match this growth. After reaching a peak of 1,347 incidents in 2019, violent protest activity has seen a consistent decline in its share of the total.
In 2016, violent events made up roughly 8.7 percent of all protests. By 2021, that figure had plummeted to 3.1 percent. Even with the heightened activity in 2026, violent incidents account for a relatively modest 3.7 percent of the total, suggesting that India’s culture of protest is becoming increasingly characterized by democratic, non-violent expression.
Geographical Distribution of Unrest
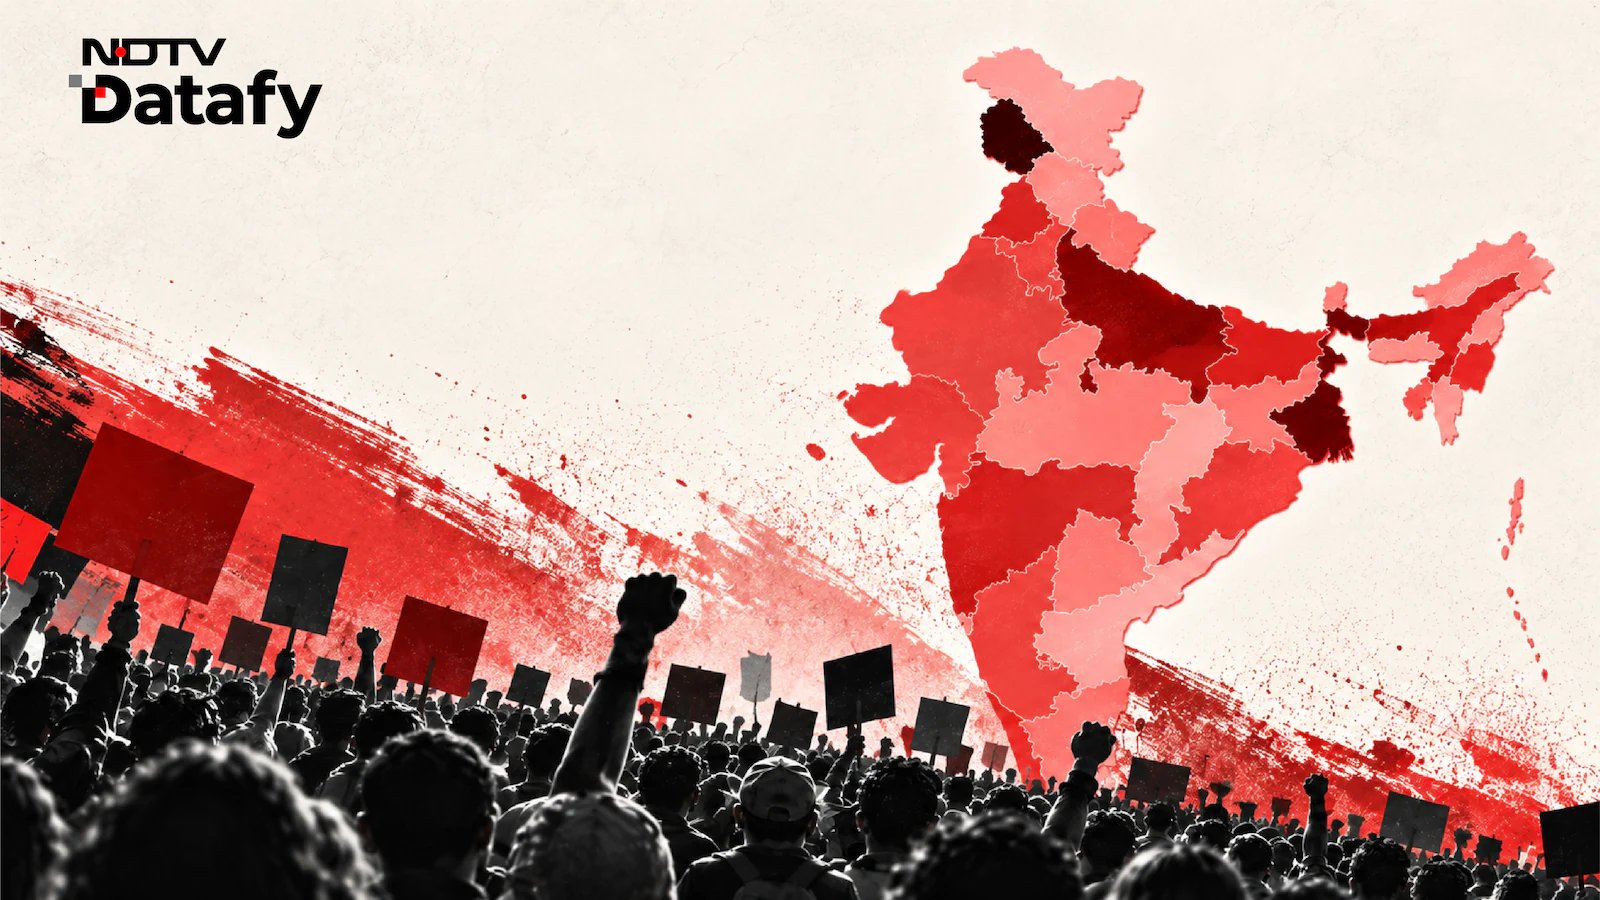
Data spanning 2015 to late 2026 highlights that violent incidents are not spread uniformly across the country. Jammu and Kashmir tops the list with 1,377 recorded violent demonstrations, followed by West Bengal at 1,043. Other states, including Uttar Pradesh (685), Assam (521), and Bihar (500), have also recorded higher frequencies of protest-related violence compared to the national average. Odisha, Kerala, and Manipur have each reported over 450 such incidents.
Ultimately, while the frequency of public protests has nearly doubled over the last ten years, the evidence underscores a robust shift toward peaceful, organized advocacy, suggesting that while Indian citizens are more active than ever in voicing their concerns, they are doing so within the bounds of civil discourse.
Disclaimer: This content is auto-generated for informational purposes only.
Source: Read Original News