








Delhi Air Quality Plummets to ‘Very Poor’ as Seasonal Smog Returns
Delhi’s air quality took a sharp turn for the worse this Tuesday, with the city recording an Air Quality Index (AQI) of 350. This figure marks the highest pollution level the capital has experienced since January 20, pushing the air firmly into the “very poor” category. By early evening, the situation had intensified at localized levels, with 11 of the city’s 57 monitoring stations slipping into the “severe” zone.
The regional disparity in air quality remains stark. While residents in areas like Jahangirpuri faced hazardous conditions with readings hitting 459, others in parts like Lodhi Road recorded significantly lower, though still concerning, levels at 212. Meteorological conditions, including calm wind speeds during the night, have trapped pollutants near the surface, exacerbating the toxic haze.
A Complex Web of Factors
The recent spike in pollution is attributed to a combination of stagnant weather and the persistent issue of agricultural burning in neighboring states. On Monday night, NASA satellites identified 167 farm fires across Punjab and Haryana. However, experts caution that this figure is likely a significant undercount, as satellite flyovers often miss fires lit during late afternoon and evening hours.
Understanding these fluctuations requires more than just a single daily number. For instance, the air quality narrative in Delhi changed dramatically over the last week. Following a heavy downpour on October 29—which saw 60.5mm of rain at Safdarjung—the AQI plummeted from 222 to a “satisfactory” 60 overnight. Yet, by November 1, calm winds and a renewed surge in stubble burning caused the index to climb back to 261. These wild swings demonstrate that looking at isolated data points often obscures the true drivers of the city’s environmental crisis.
Data-Driven Transparency
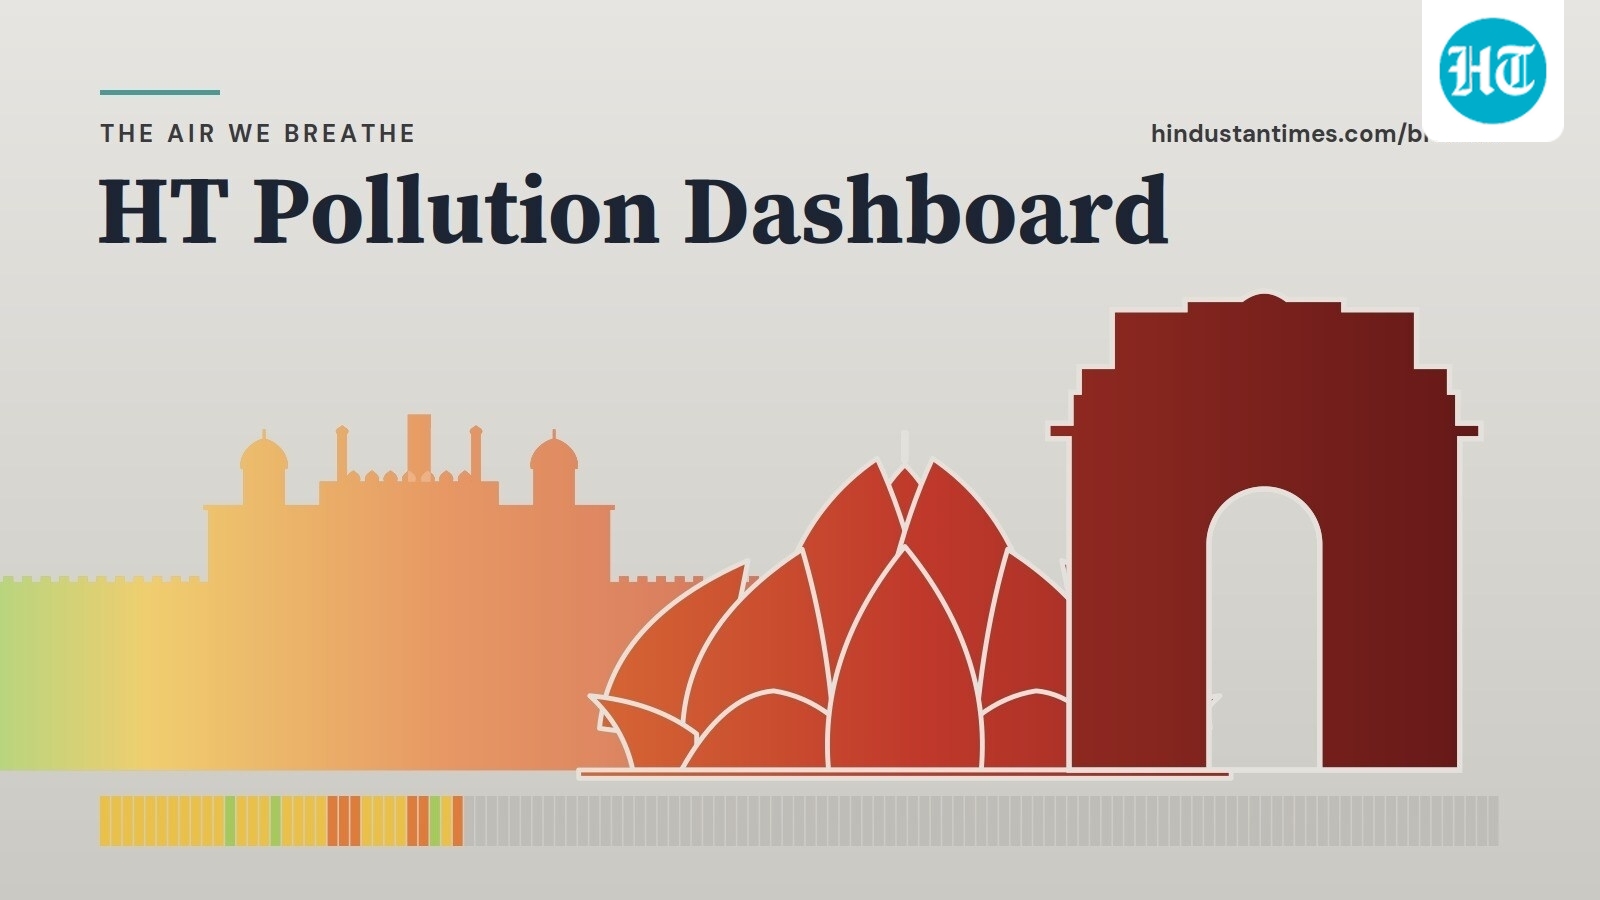
To provide residents with a clearer picture of their surroundings, the Hindustan Times has launched the HT Pollution Dashboard. Accessible via the website and the HT mobile app, the tool consolidates data from the Central Pollution Control Board (CPCB), the India Meteorological Department (IMD), and NASA.
By integrating official government figures with real-time variables—such as wind direction, farm fire counts, and atmospheric mixing heights—the dashboard allows users to monitor the air they breathe with greater precision. Unlike standalone apps that may utilize varied sensor scales, this platform relies exclusively on standardized, government-verified data used to implement critical emergency measures like the Graded Response Action Plan (GRAP).
Navigating the Smog
The dashboard is designed to demystify the complex relationship between weather and pollution. It offers granular insights, such as:
- Neighborhood Monitoring: Users can toggle their specific location to identify the nearest station and see how their immediate area ranks against the city-wide average.
- Meteorological Impact: Regular updates indicate whether prevailing weather conditions are aiding in pollutant dispersion or acting as a trap for smog.
- Historical Context: Users can contrast daily readings against data from every season dating back to 2015-16, providing a long-term view of how the city’s air quality is evolving.
As Delhi enters the height of the winter pollution season, these tools are becoming essential for residents to make informed decisions about their health. With the dashboard covering the broader National Capital Region—including Noida, Ghaziabad, Gurugram, and Faridabad—the aim is to move beyond the confusion of fragmented reports toward a unified, science-backed understanding of the air quality crisis.
Disclaimer: This content is auto-generated for informational purposes only.
Source: Read Original News