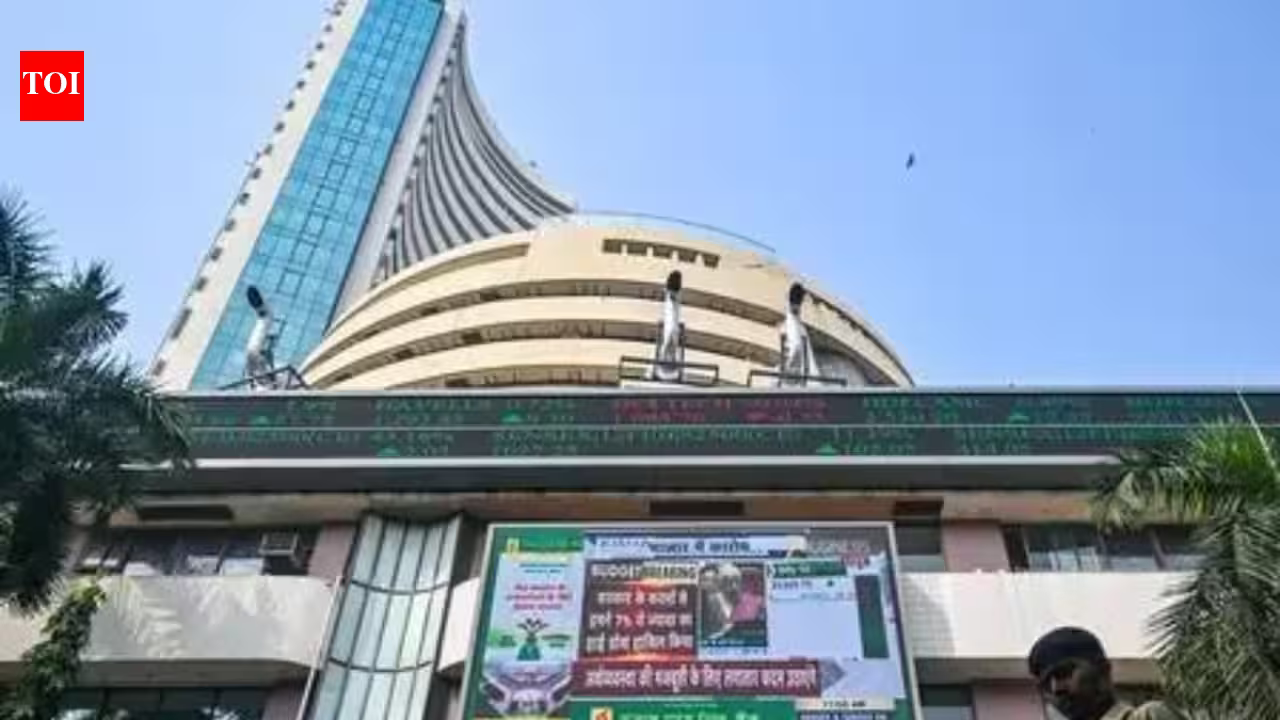









Navigating Market Volatility: Analyzing Recent Technical Recommendations
The current state of the Indian equity markets reflects a period of significant technical realignment. As of September 10, 2026, market participants are observing a divergence between broader index trends and specific sectoral outperformance. The Nifty and Bank Nifty indices have recently breached critical support thresholds, signaling a phase of heightened caution for institutional and retail investors alike. Despite this overarching bearish pressure on the benchmark indices, specific stocks have demonstrated relative strength, suggesting that selective stock picking remains a viable strategy even in a correcting market.
Technical analysis, as highlighted by experts at Nuvama Professional Clients Group, points toward a critical juncture for the indices. When major benchmarks like the Nifty break beneath key psychological support zones—such as the 23600-650 range—the subsequent price discovery often involves testing lower demand areas. For traders and investors, the current environment necessitates a disciplined adherence to stop-loss mechanisms and a focus on assets showing idiosyncratic strength that defies the general downward pull of the broader market.
Sectoral Outperformers: Decoding the Strength in Fintech and Retail
A noteworthy trend in the current market cycle is the resilience shown by companies that were previously under intense scrutiny. Paytm, for instance, has transitioned into a position of market outperformance. Trading near its 52-week high, the stock displays momentum characteristics that typically attract trend-following institutional capital. From a technical standpoint, the expectation that the stock might test its original listing-day high indicates a significant recovery trajectory, bolstered by improved sentiment and operational consolidation.
Similarly, the retail space, represented by Nykaa, has reached valuation levels not observed in the last four years. This move is significant because it indicates a break from long-term stagnation. When a stock achieves multi-year highs, it often suggests that the structural headwinds that suppressed its performance have been mitigated. For investors, the target of Rs 370 suggests a continuation of the current momentum, provided the stock maintains its current support levels. These specific cases illustrate that market participants are increasingly valuing entities that have successfully navigated their post-IPO volatility phases and are now demonstrating clear fiscal and operational progress.
Infrastructure and Water Management: The Case for VA Tech Wabag
Beyond consumer-facing technology and retail, the industrial sector continues to provide specific opportunities, particularly in thematic areas like water management and infrastructure. VA Tech Wabag presents a compelling case study of a technical breakout following a period of consolidation. The stock’s recent bounce from its 20-day moving average (DMA), coupled with the highest daily trading volume observed in three months, signals a renewal of interest from market participants.
Technical indicators suggest that the three-month consolidation phase for the company has likely concluded. The psychological barrier of Rs 2200 acts as a critical pivot point; once surpassed, the momentum is expected to accelerate toward the Rs 2350-2400 range. This illustrates the importance of volume-based analysis in the Indian context. High trading volume during a price recovery is a definitive indicator of institutional accumulation, which often precedes sustained price appreciation in mid-cap industrial firms. For investors, monitoring these volume patterns is essential for confirming whether a technical breakout is sustainable or merely a temporary fluctuation.
Technical Outlook for Nifty and Bank Nifty
The broader market indicators, Nifty and Bank Nifty, currently dictate the risk appetite of the Indian investor base. The breakdown of Nifty below the 23600-650 support zone is a technical signal that suggests the index is entering a phase of deeper correction. While oversold conditions on shorter timeframes may lead to minor relief rallies, the technical consensus remains that the index is under bearish control. The requirement for Nifty to reclaim the 23750 level confirms that the market is currently in a “sell-on-rise” structure, where rallies are being met with fresh selling pressure.
Bank Nifty mirrors this struggle, having closed convincingly below the 56800 mark. The next defensive zone for the banking index lies between 55500 and 55700. The banking sector’s performance is intrinsically linked to macroeconomic signals and credit growth expectations in India. A failure to hold these levels could signify broader systemic weakness or a reassessment of interest rate trajectories by the central bank. Consequently, until the index clears the 57000-mark resistance, the outlook for banking stocks remains guarded. Investors are advised to prioritize capital preservation over aggressive long positioning until these indices show clear signs of structural stability.
Strategic Risk Management in a Bearish Climate
In periods characterized by bearish trends, the role of disciplined risk management becomes paramount. The recommendations provided by market analysts regarding stop-loss levels are not merely suggestions but essential tools for capital protection. For instance, maintaining a stop-loss at Rs 1680 for Paytm or Rs 330 for Nykaa serves to truncate potential losses should the momentum unexpectedly reverse.
The Indian stock market has grown increasingly complex, with the rise of retail participation often leading to higher intra-day volatility. In such an ecosystem, professional investors utilize technical triggers to manage the asymmetry of risk and reward. Understanding the difference between a temporary pullback and a structural reversal is key. Investors must distinguish between companies with strong fundamentals that are caught in a general market downturn and those whose price action is signaling a genuine loss of competitive standing.
Furthermore, the integration of both macro indicators—such as index support and resistance levels—and micro-level stock analysis is crucial for long-term portfolio growth. Relying exclusively on one can be detrimental in the volatile Indian market. As market conditions evolve, the ability to synthesize technical data with an understanding of individual company performance will distinguish successful market participants from those susceptible to market noise. Keeping a close watch on volume, moving averages, and index correlations, as outlined in current market analyses, remains the most effective methodology for navigating the remainder of the 2026 fiscal cycle.
Disclaimer: This content is auto-generated for informational purposes only.
Source: Read Original News