








Understanding the AQI Divide: Why Government Data and Private Apps Often Clash
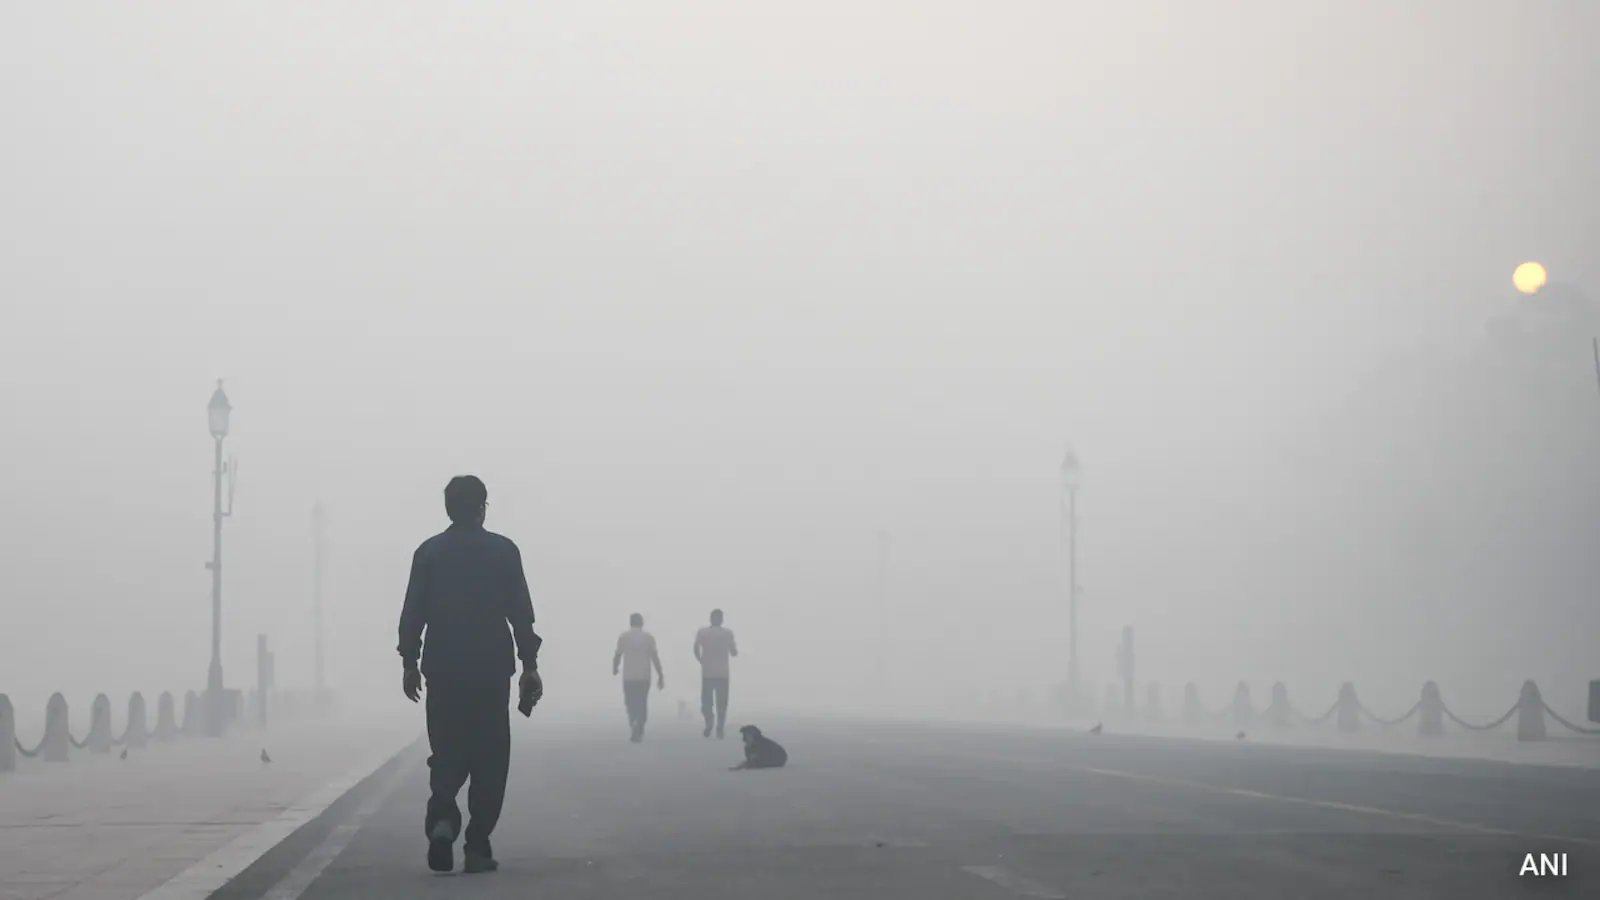
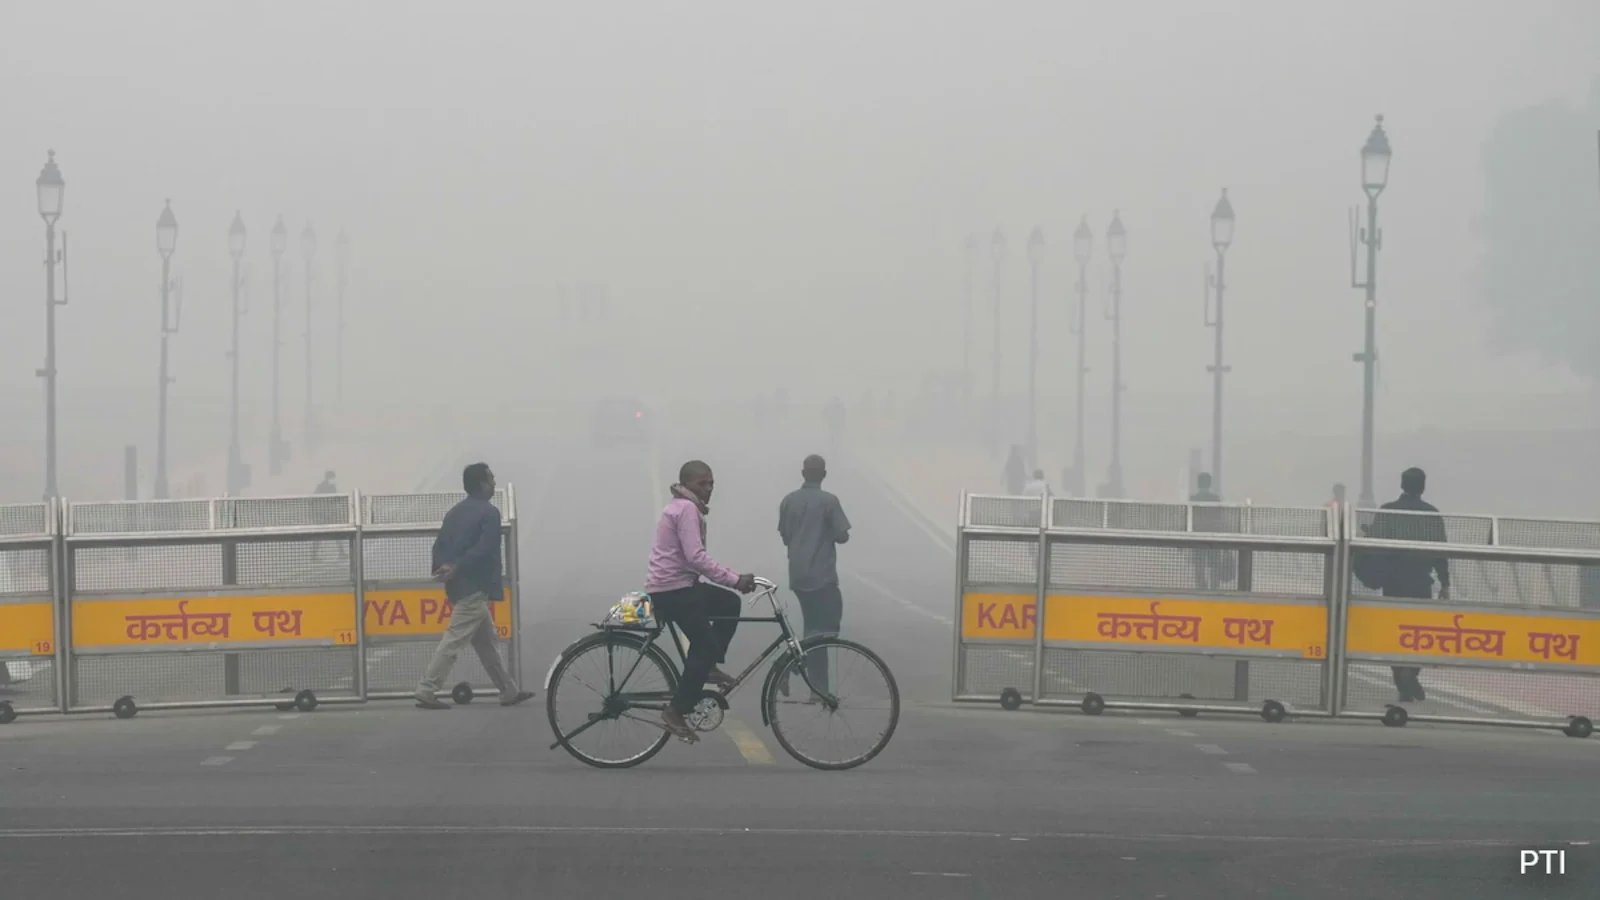
The air quality discourse in India recently hit a fever pitch following Diwali, as citizens grew increasingly confused by a massive disparity in data. While the Central Pollution Control Board’s (CPCB) ‘Sameer’ app registered air quality index (AQI) values near the 400-mark—placing them firmly in the ‘severe’ category—various private weather applications and global platforms were displaying figures exceeding 1,000. This discrepancy sparked accusations of opacity and data manipulation directed at government agencies. In response, the CPCB has provided a detailed clarification, urging citizens to look beyond raw numbers and understand the science of air quality monitoring.
The NAQI: More Than Just a Number
At the heart of the confusion lies a fundamental misunderstanding of what the National Air Quality Index (NAQI) represents. The CPCB emphasizes that the index is not merely a data-collection device but a health-communication tool. Its primary purpose is to translate complex technical concentrations of pollutants into an easy-to-understand scale that warns citizens about potential health risks.
According to the regulatory body, the NAQI model relies on the National Ambient Air Quality Standards (NAAQS) established in 2009. Unlike platforms that may focus on instantaneous, minute-by-minute fluctuations, the NAQI prioritizes cumulative exposure. “The NAQI recognises that prolonged exposure, rather than a momentary reading, is the more relevant indicator of ill effects on human health,” the CPCB noted, explaining why their metrics are built around 8-hour and 24-hour weighted averages. By design, the index focuses on the health statement associated with the category rather than the specific numerical value.
Why the 500 Ceiling?
A frequent point of public contention is the “capping” of the index at 500. During periods of extreme smog, observers often ask why the AQI does not rise to reflect values like 800 or 1,000. The CPCB maintains that this is a deliberate design choice, mirroring international best practices such as those used by the US EPA.
The rationale is functional: once the index hits 500, it enters the ‘Severe’ category, which indicates that the air poses a serious health risk to everyone, particularly those with pre-existing respiratory or cardiac conditions. Extending the numerical scale beyond this point serves no added utility for public health alerts, as the severity of the advice remains constant.
Divergence from Private Platforms
The CPCB was firm in addressing why third-party apps often show significantly higher peaks. The variance, the board claims, is rooted in the quality of hardware and software. Many private apps rely on “low-cost sensors” that lack the rigorous calibration and quality assurance standards mandated for official government monitoring stations.
Furthermore, these apps often calculate AQI using hourly snapshots rather than the smoothed, long-term averages used by the NAQI. This creates a “time-lag” effect: while private apps may show more aggressive spikes during firecracker events, they may conversely show cleaner air than the government index once those episodes subside, as the NAQI continues to account for the lingering pollutants of the preceding 24 hours.
“The difference in AQI values is attributable to differences in measurement and methodology, and not to under-reporting,” the board asserted. As the nation grapples with seasonal pollution, the CPCB highlighted its effort to improve transparency, noting a massive expansion in the network of Continuous Ambient Air Quality Monitoring Stations—from just 30 stations a decade ago to over 630 today—providing a more robust foundation for the data Indians rely on daily.
Disclaimer: This content is auto-generated for informational purposes only.
Source: Read Original News